Dead or Just Sleeping? A Quant Defense of Dividend Stocks in an AI World
 Anthony Marinov
 If you’ve opened a brokerage app in the last five years, you’ve probably absorbed the unofficial investing religion of our time:
Growth is good. Dividends are… cute.
We’re living in the era of the parabolic chart. AI hype cycles, semiconductor super-cycles, and mega-cap tech dominance have made investing feel less like reading cash-flow statements and more like trying not to fall off a rocket ship.
In that world, dividend stocks—the boring, steady companies that sell toothpaste, insurance, railroads, and the occasional gallon-sized tub of mayonnaise—feel like your grandfather’s portfolio.
And the prevailing sentiment (from Wall Street to Reddit to your group chat) is pretty clear:
Why take a dividend when you could just own the company that’s going up 40% this year?
Fair question. I’m not allergic to growth. I own growth.
But as both a developer and an investor, I don’t love arguments that end with vibes.
So I did what any reasonable person does when confronted with market sentiment:
I opened a Jupyter notebook and tried to bully the debate into math.
Summary (TLDR)
- Dividends aren’t “dead money” if you reinvest them (DRIP). They’re a different compounding engine: share count growth.
- In my 10-year ETF study (SCHD vs SCHG):
- Max total return picked 0% SCHD / 100% SCHG
- Max Sharpe picked 60.9% SCHD / 39.1% SCHG
- In the 20-year custom ETF window (~2005–2025), the optimizer leaned growth-heavy partly because it misses the dot-com unwind:
- Max Sharpe picked 7.1% Dividend / 92.9% Growth
- In the 30-year window (~1995–2025), the dot-com era is included and the optimizer adds real ballast:
- Max Sharpe picked 45.6% Dividend / 54.4% Growth
- Practical takeaway: starting near ~50/50 is a pretty robust default, then tilt based on goals and stomach lining.
The debate is really about regimes
The growth vs dividend argument usually gets framed like a personality test:
- Growth investors are bold visionaries.
- Dividend investors are cautious adults with a drawer full of AA batteries.
But the real conflict is simpler:
Different strategies dominate in different market regimes.
- In bullish, liquidity-rich markets, high-growth companies can compound brutally fast.
- In volatile or sideways markets, cash-flowing businesses + reinvestment can quietly keep building.
So the right question isn’t “which strategy is better forever?”
It’s:
What mix gives you strong returns and the ability to stay invested when things get ugly?
That’s where risk-adjusted return matters.
Why Sharpe Ratio (and why I used it anyway)
Total return is seductive. It’s also incomplete.
Two portfolios can end at the same place, but one makes you feel like a genius and the other makes you feel like you’re getting chased through the woods.
Sharpe ratio is a simple way to measure “return per unit of volatility.”
In plain English:
- Higher Sharpe = more return for the stress you endured.
- Lower Sharpe = you’re getting paid, but you’re earning it in emotional damage.
I’m not claiming Sharpe is perfect (we’ll talk limitations), but it’s a good objective for this project because it forces the optimizer to respect risk.
Dividends don’t “reduce” returns — DRIP is compounding with a different engine
People talk about dividends like they’re a consolation prize.
But dividends are only “dead money” if you treat them like dead money.
With DRIP (dividend reinvestment), dividends become a mechanical compounding loop:
- Company pays you cash.
- You buy more shares.
- Next quarter you get paid on more shares.
- Repeat until you either retire or become unbearable at dinner parties.
Growth compounds through price appreciation.
Dividend strategies compound through share count growth (plus whatever price does).
Different engine, same goal: more ownership over time.
The experiment: treat asset allocation like an engineering problem
I built a small backtesting + optimization setup in Python:
- Pull price/dividend history from Yahoo Finance (
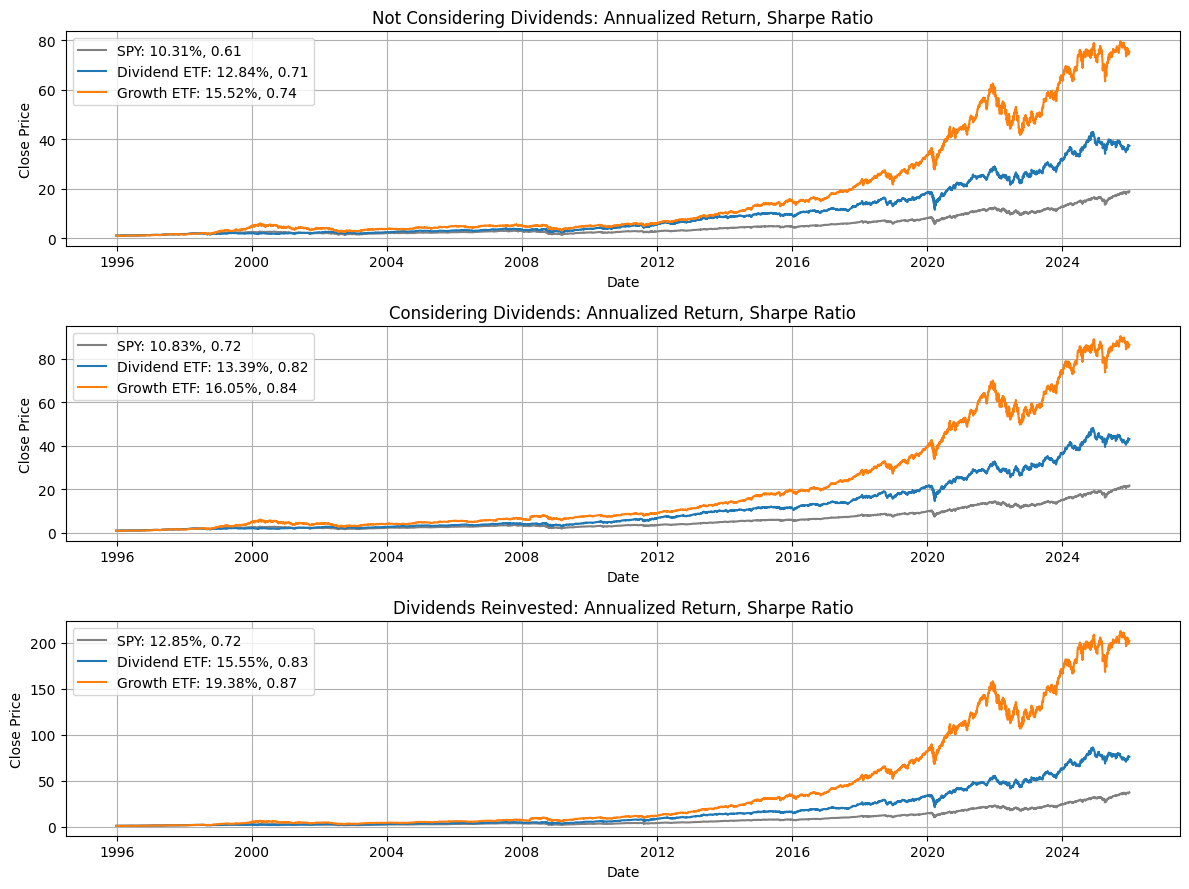
yfinance) - Simulate returns with:
- price-only,
- dividends included,
- dividends reinvested (DRIP)
- Optimize allocations using
scipy.optimize.minimize(SLSQP)
Then I ran a few studies:
- 10-year real ETF proxy study (SCHG = growth, SCHD = dividends, SPY/VOO = benchmark)
- Longer horizon custom ETF study (because SCHD/SCHG don’t have decades of data)
- “Perfect portfolios”: choose from a pool of stocks and let the optimizer build the best mix
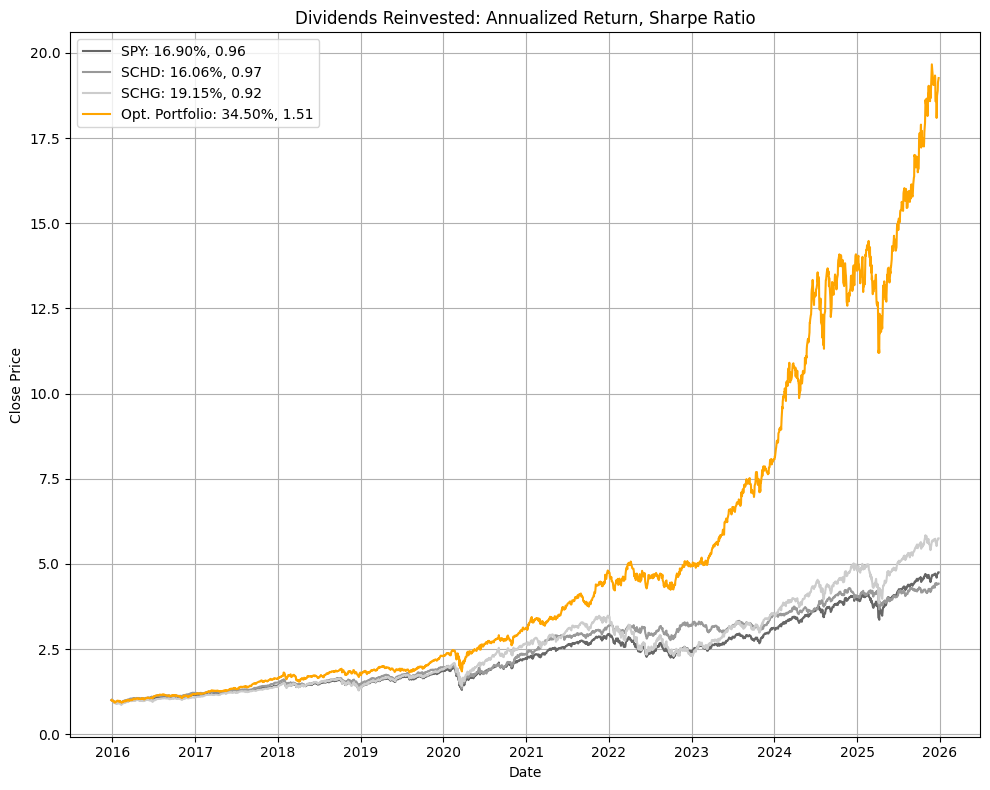
Results
1) The last 10 years: the Growth Mirage (but with a twist)
Here’s the part where growth investors feel validated.
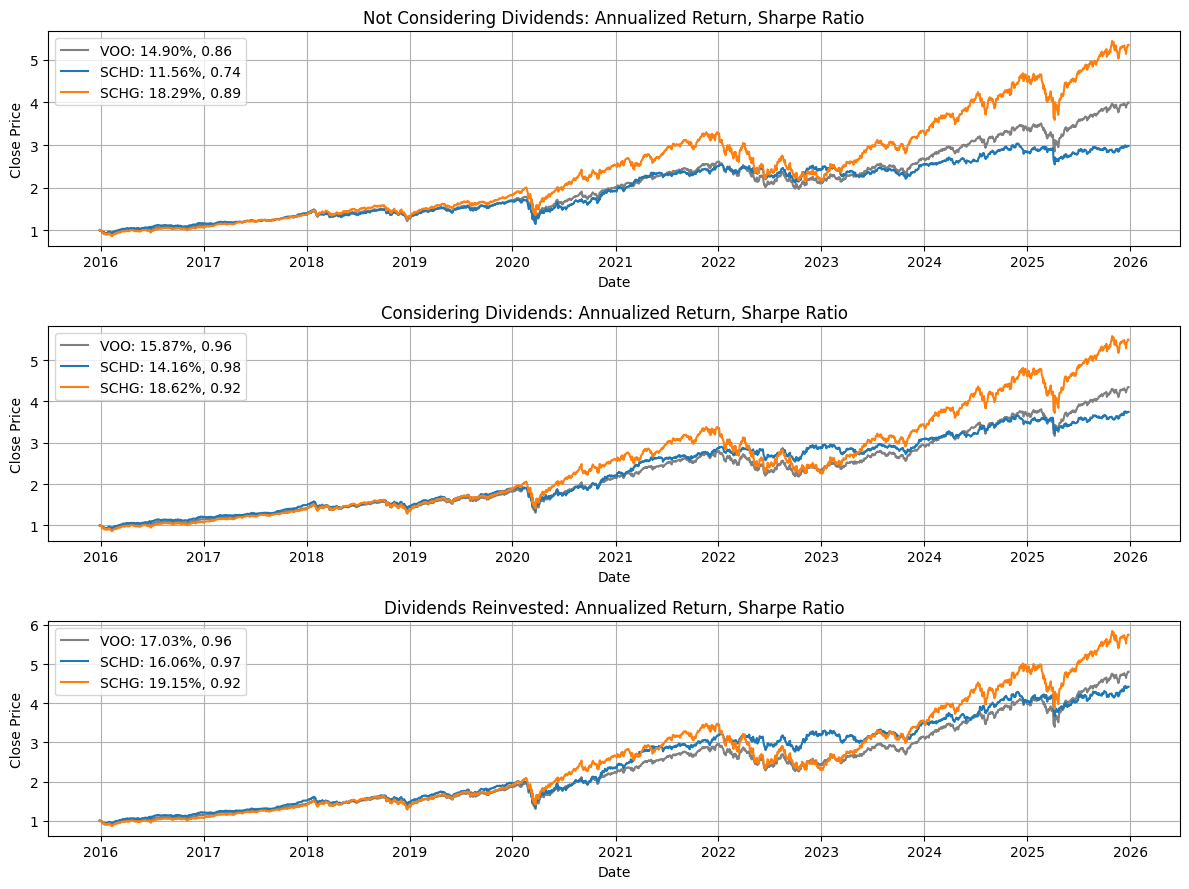
Over the last decade (a very growth-friendly decade), SCHG beats SCHD on total return.
But when you look at risk-adjusted return, things get more interesting:
- Dividend exposure often improves stability.
- The Sharpe ratio can favor a blend even when growth wins the return race.
So I asked the optimizer two blunt questions:
If your job is to maximize total return, how much growth vs dividends do you want?
If your job is to maximize Sharpe, how much growth vs dividends do you want?
Here’s what it picked in the ETF study:
- Max total return: 0.0% SCHD / 100.0% SCHG
- Max Sharpe: 60.9% SCHD / 39.1% SCHG
The optimizer’s answer: not all-in tech
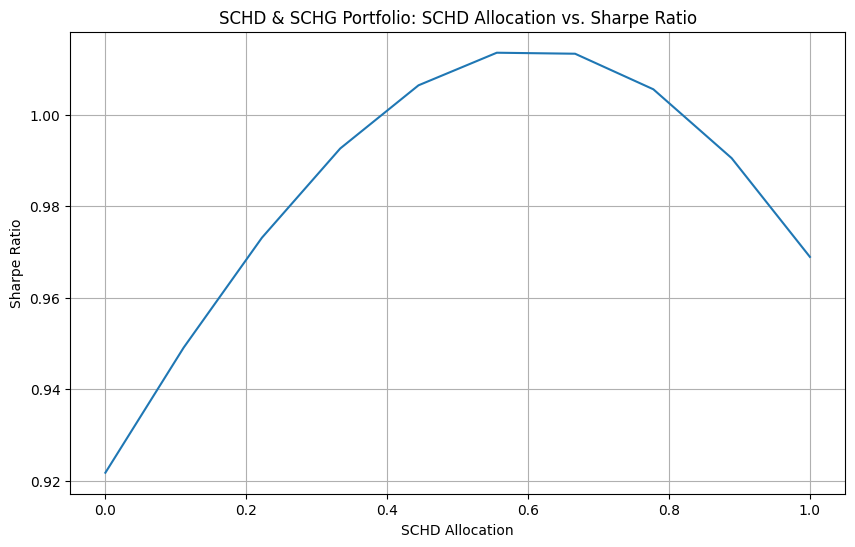
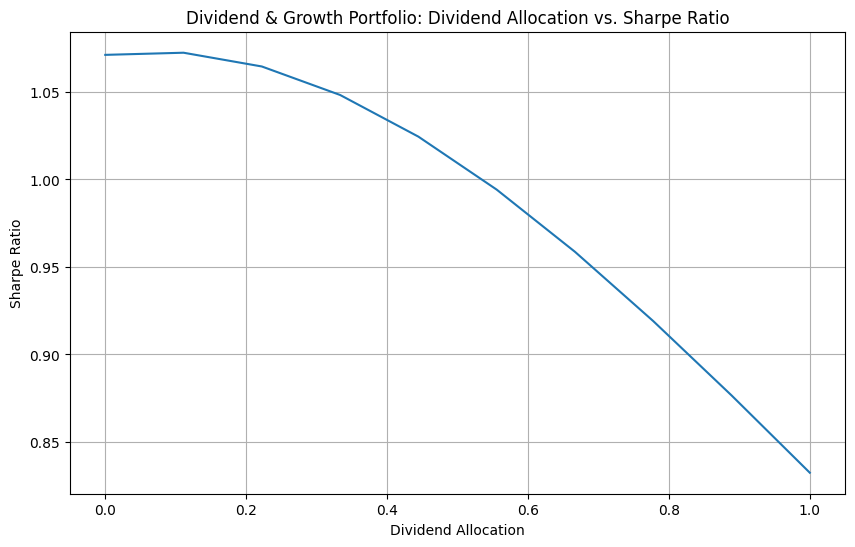
This curve is the thesis in one picture:
Sharpe doesn’t peak at ‘100% growth.’
It peaks at a blend—a portfolio that keeps growth exposure but uses dividend payers as shock absorbers.
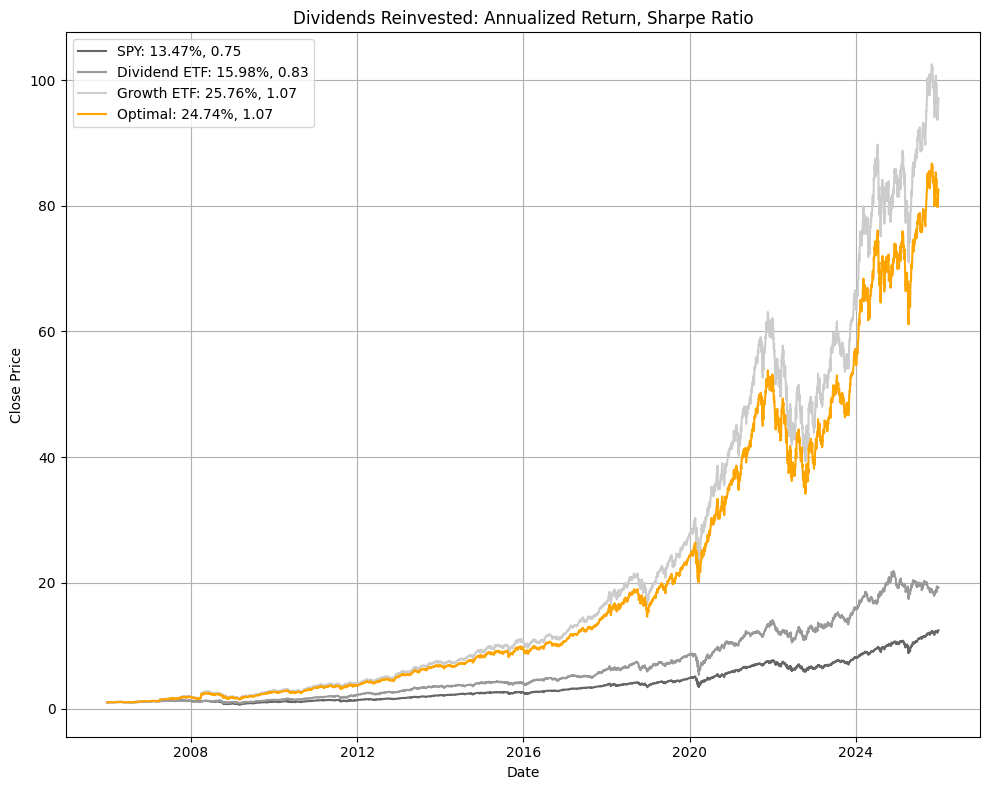
And when you plot the Sharpe-optimal blend against the two ETFs:
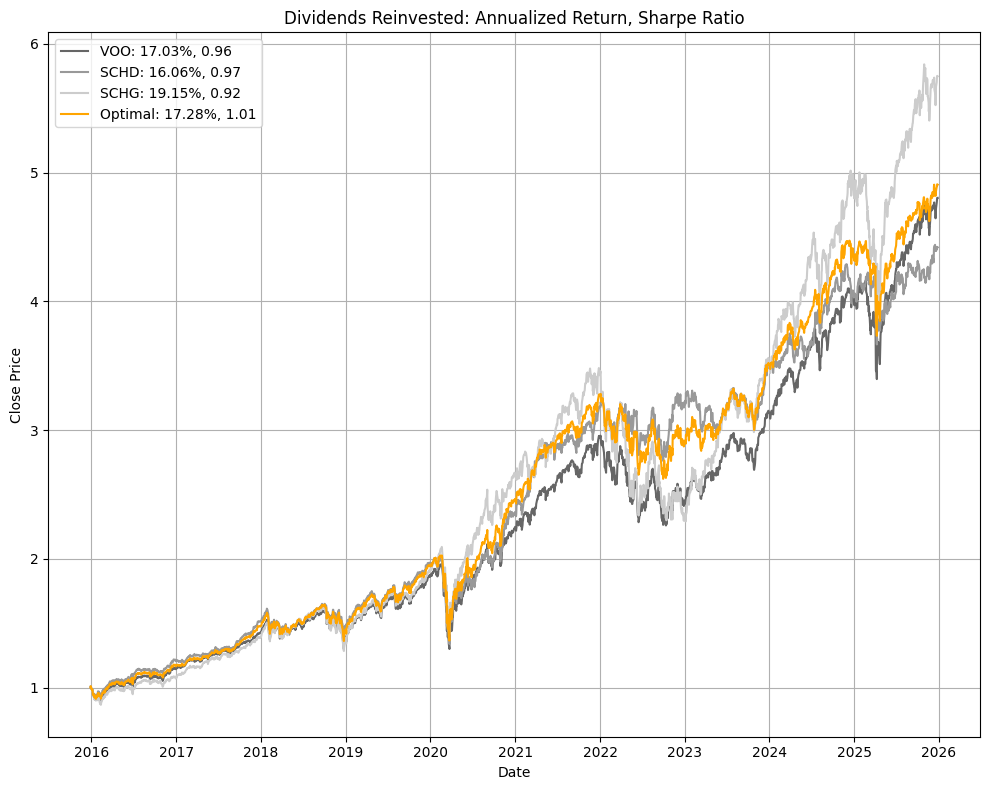
The “optimal” portfolio isn’t magic. It’s just diversified exposure to two different compounding styles.
Takeaway:
In a growth-dominated decade, dividends still earned their spot—not because they “won,” but because they improved the quality of returns.
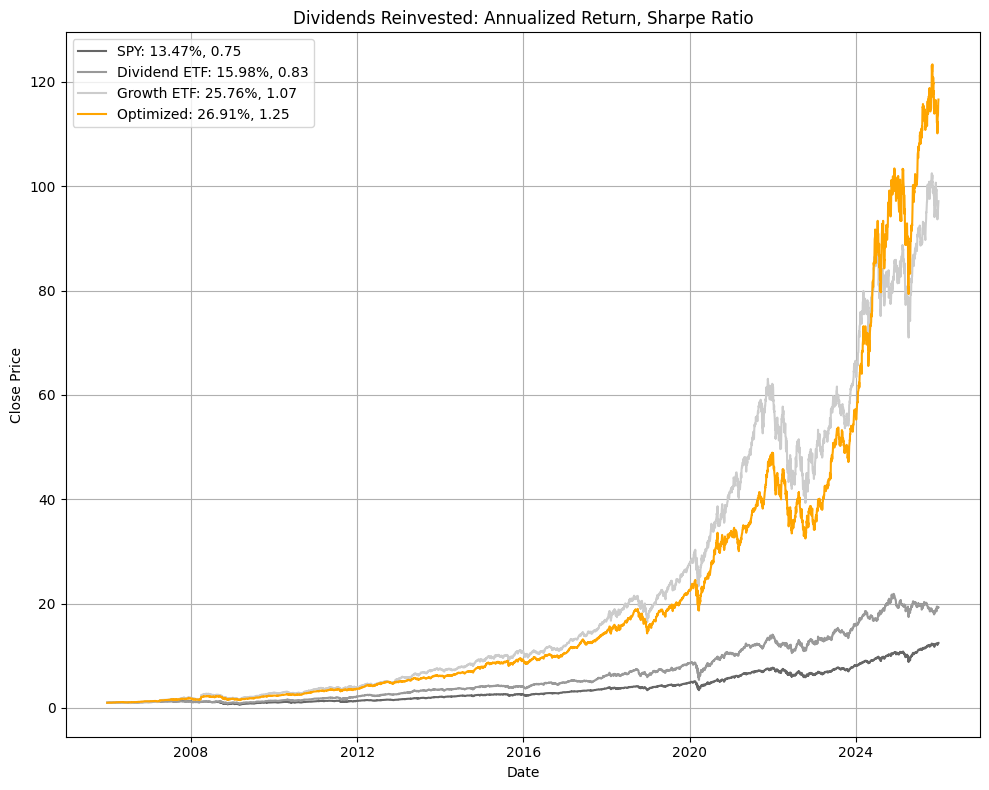
2) Zooming out: 20-year window (custom ETFs — with a dot-com caveat)
Here’s the problem with 10-year conclusions:
10 years can be a single market mood.
So I extended the study using custom baskets of companies to simulate “growth” and “dividend” sleeves over longer windows.
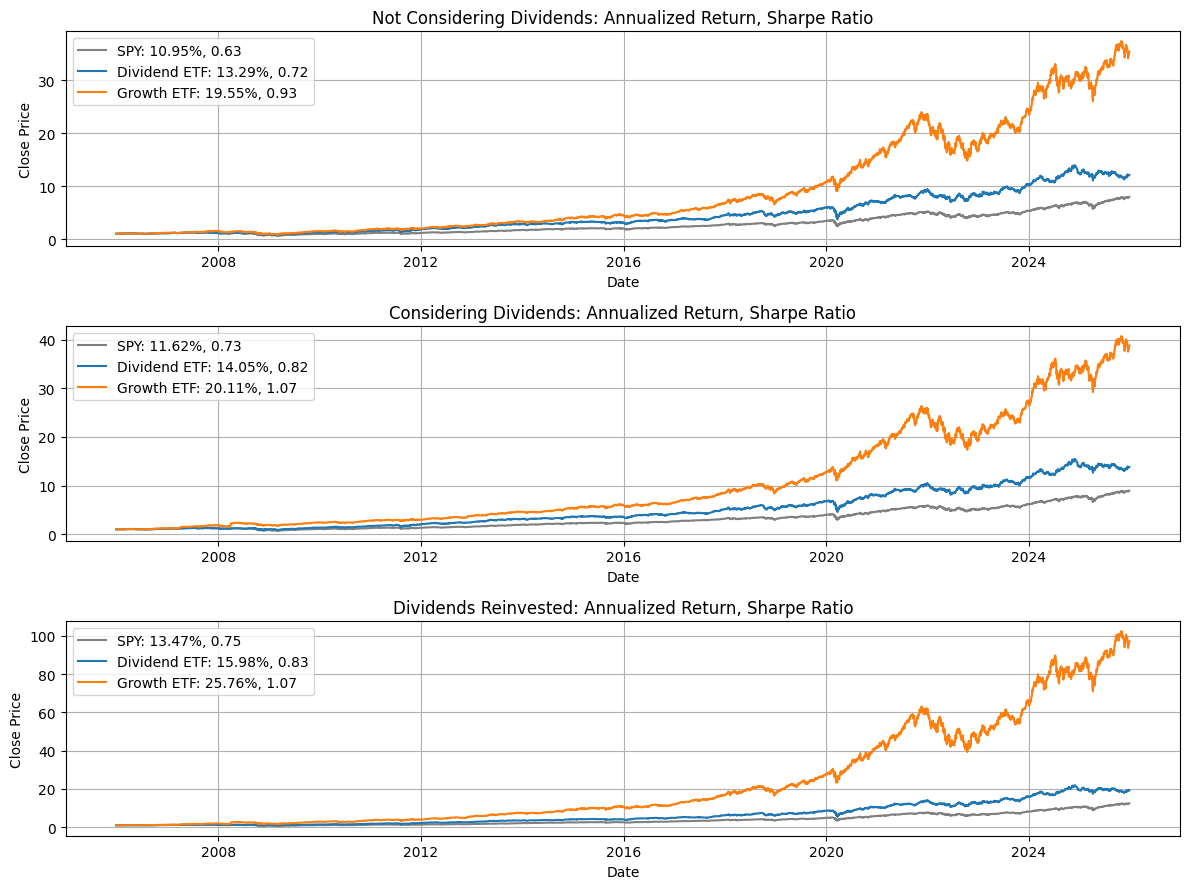
Now we’re including more market weather: drawdowns, recoveries, different rate environments, different leadership.
But it’s worth calling out one huge historical bias:
A rolling “last 20 years” window from today starts around ~2005, meaning it largely misses the dot-com bubble peak and the 2000–2002 unwind.
That era was specifically a period where growth stocks got reminded that gravity exists — so excluding it tends to make growth look cleaner than it really is over “full-cycle” history.
Then I re-ran the same Sharpe optimization.
Optimizer allocations for this 20-year custom ETF study:
- Max total return: 0.0% Dividend / 100.0% Growth
- Max Sharpe: 7.1% Dividend / 92.9% Growth
And plotted the resulting optimal portfolio against the sleeves:
Takeaway:
In this particular window, the optimizer leans heavily toward growth — and the dot-com omission is part of why. Dividends still help, but they don’t get as much “credit” here as they do in longer, more regime-complete samples.
3) 30-year window: when cycles start talking back
Over long enough periods, the market gets bored of its own narratives.
The longer the horizon, the more you force your strategy to survive multiple regimes.
And this is where the dot-com difference shows up loud and clear:
A ~30-year window starting around ~1995 includes the late-90s melt-up and the dot-com crash.
That single regime is basically a live demonstration of why “all growth, all the time” can come with a very expensive emotional subscription.
Here’s the key shift: the Sharpe curve tends to move toward more meaningful dividend allocations as you include more “uncertainty years.”
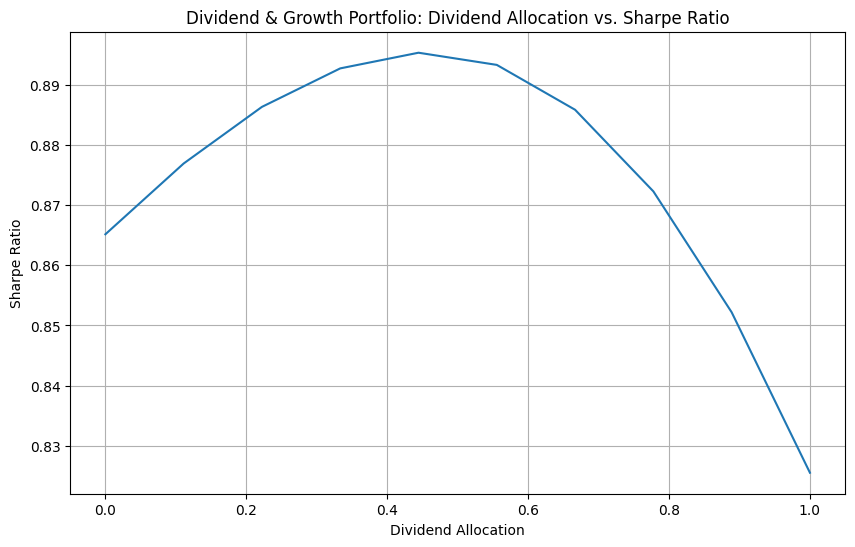
Optimizer allocations for this 30-year custom ETF study:
- Max total return: 0.0% Dividend / 100.0% Growth
- Max Sharpe: 45.6% Dividend / 54.4% Growth
And the Sharpe-optimal portfolio overlay:
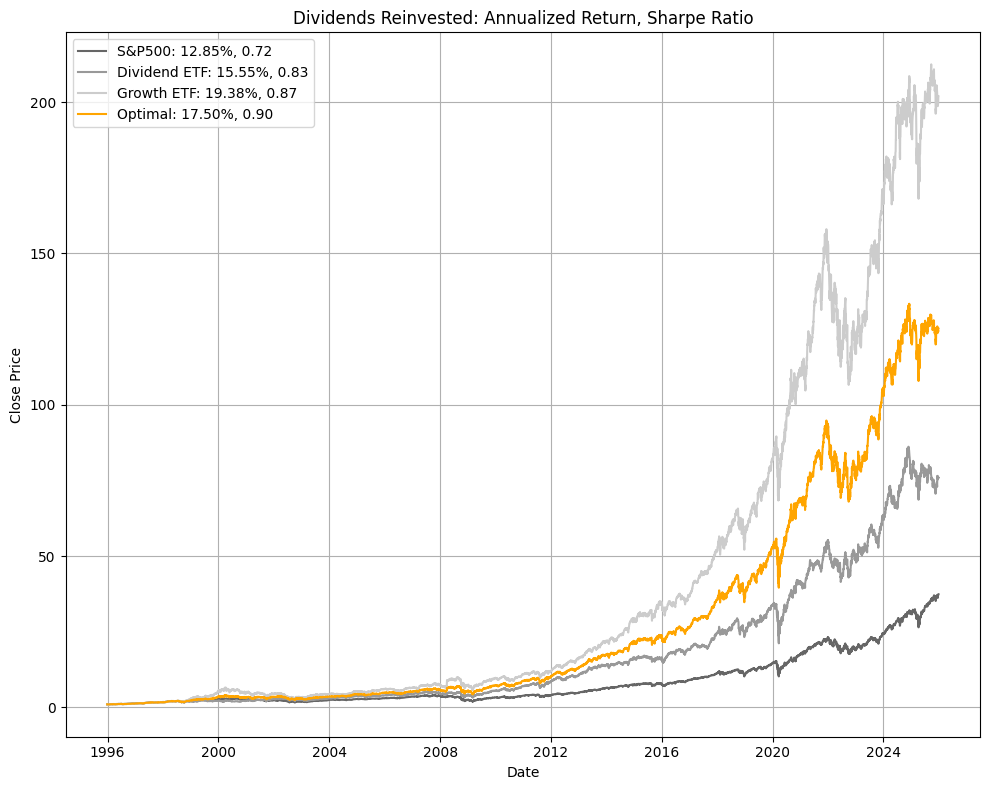
Takeaway:
Long-horizon optimization starts rewarding ballast. Not because dividends “moon,” but because they help you stay afloat — especially once you include periods where growth got absolutely humbled.
“Perfect portfolios” (a reality check I actually liked)
ETF proxy studies are nice, but they can feel like:
You optimized between two funds. Cool. That’s like choosing a restaurant by comparing two Yelp reviews.
So I ran a harder version:
- Build a pool of individual stocks (sourced from the growth + dividend universes we were studying)
- Let the optimizer pick allocations across the full pool
- Compare against the benchmark and the ETF sleeves
Perfect portfolio (20-year pool)
And the holdings breakdown:
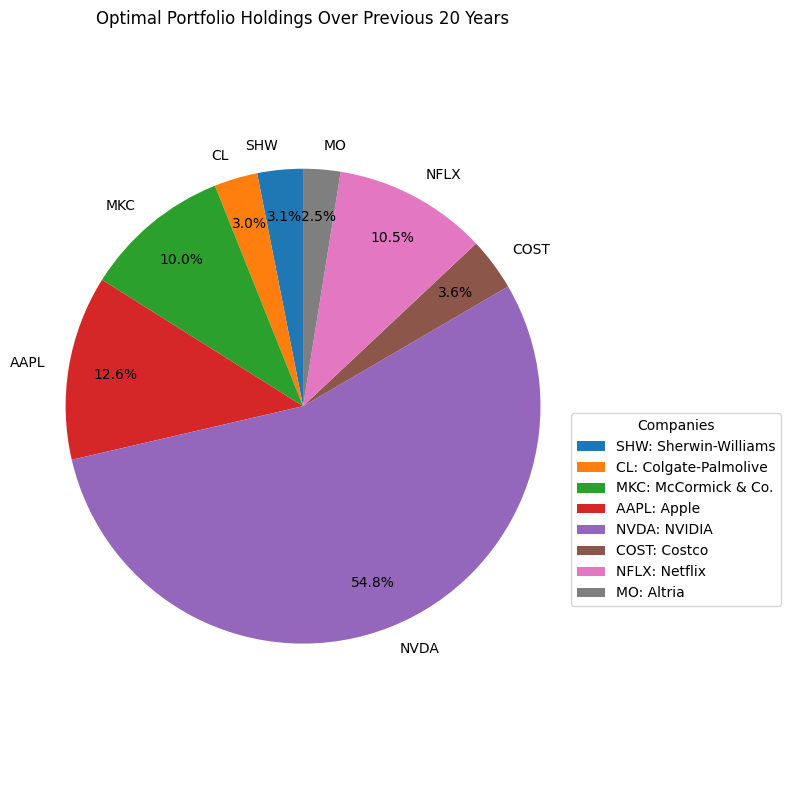
This section matters because it tests whether the “blend” idea is just SCHD/SCHG-specific.
It wasn’t.
Perfect portfolio (10-year pool)
Holdings:
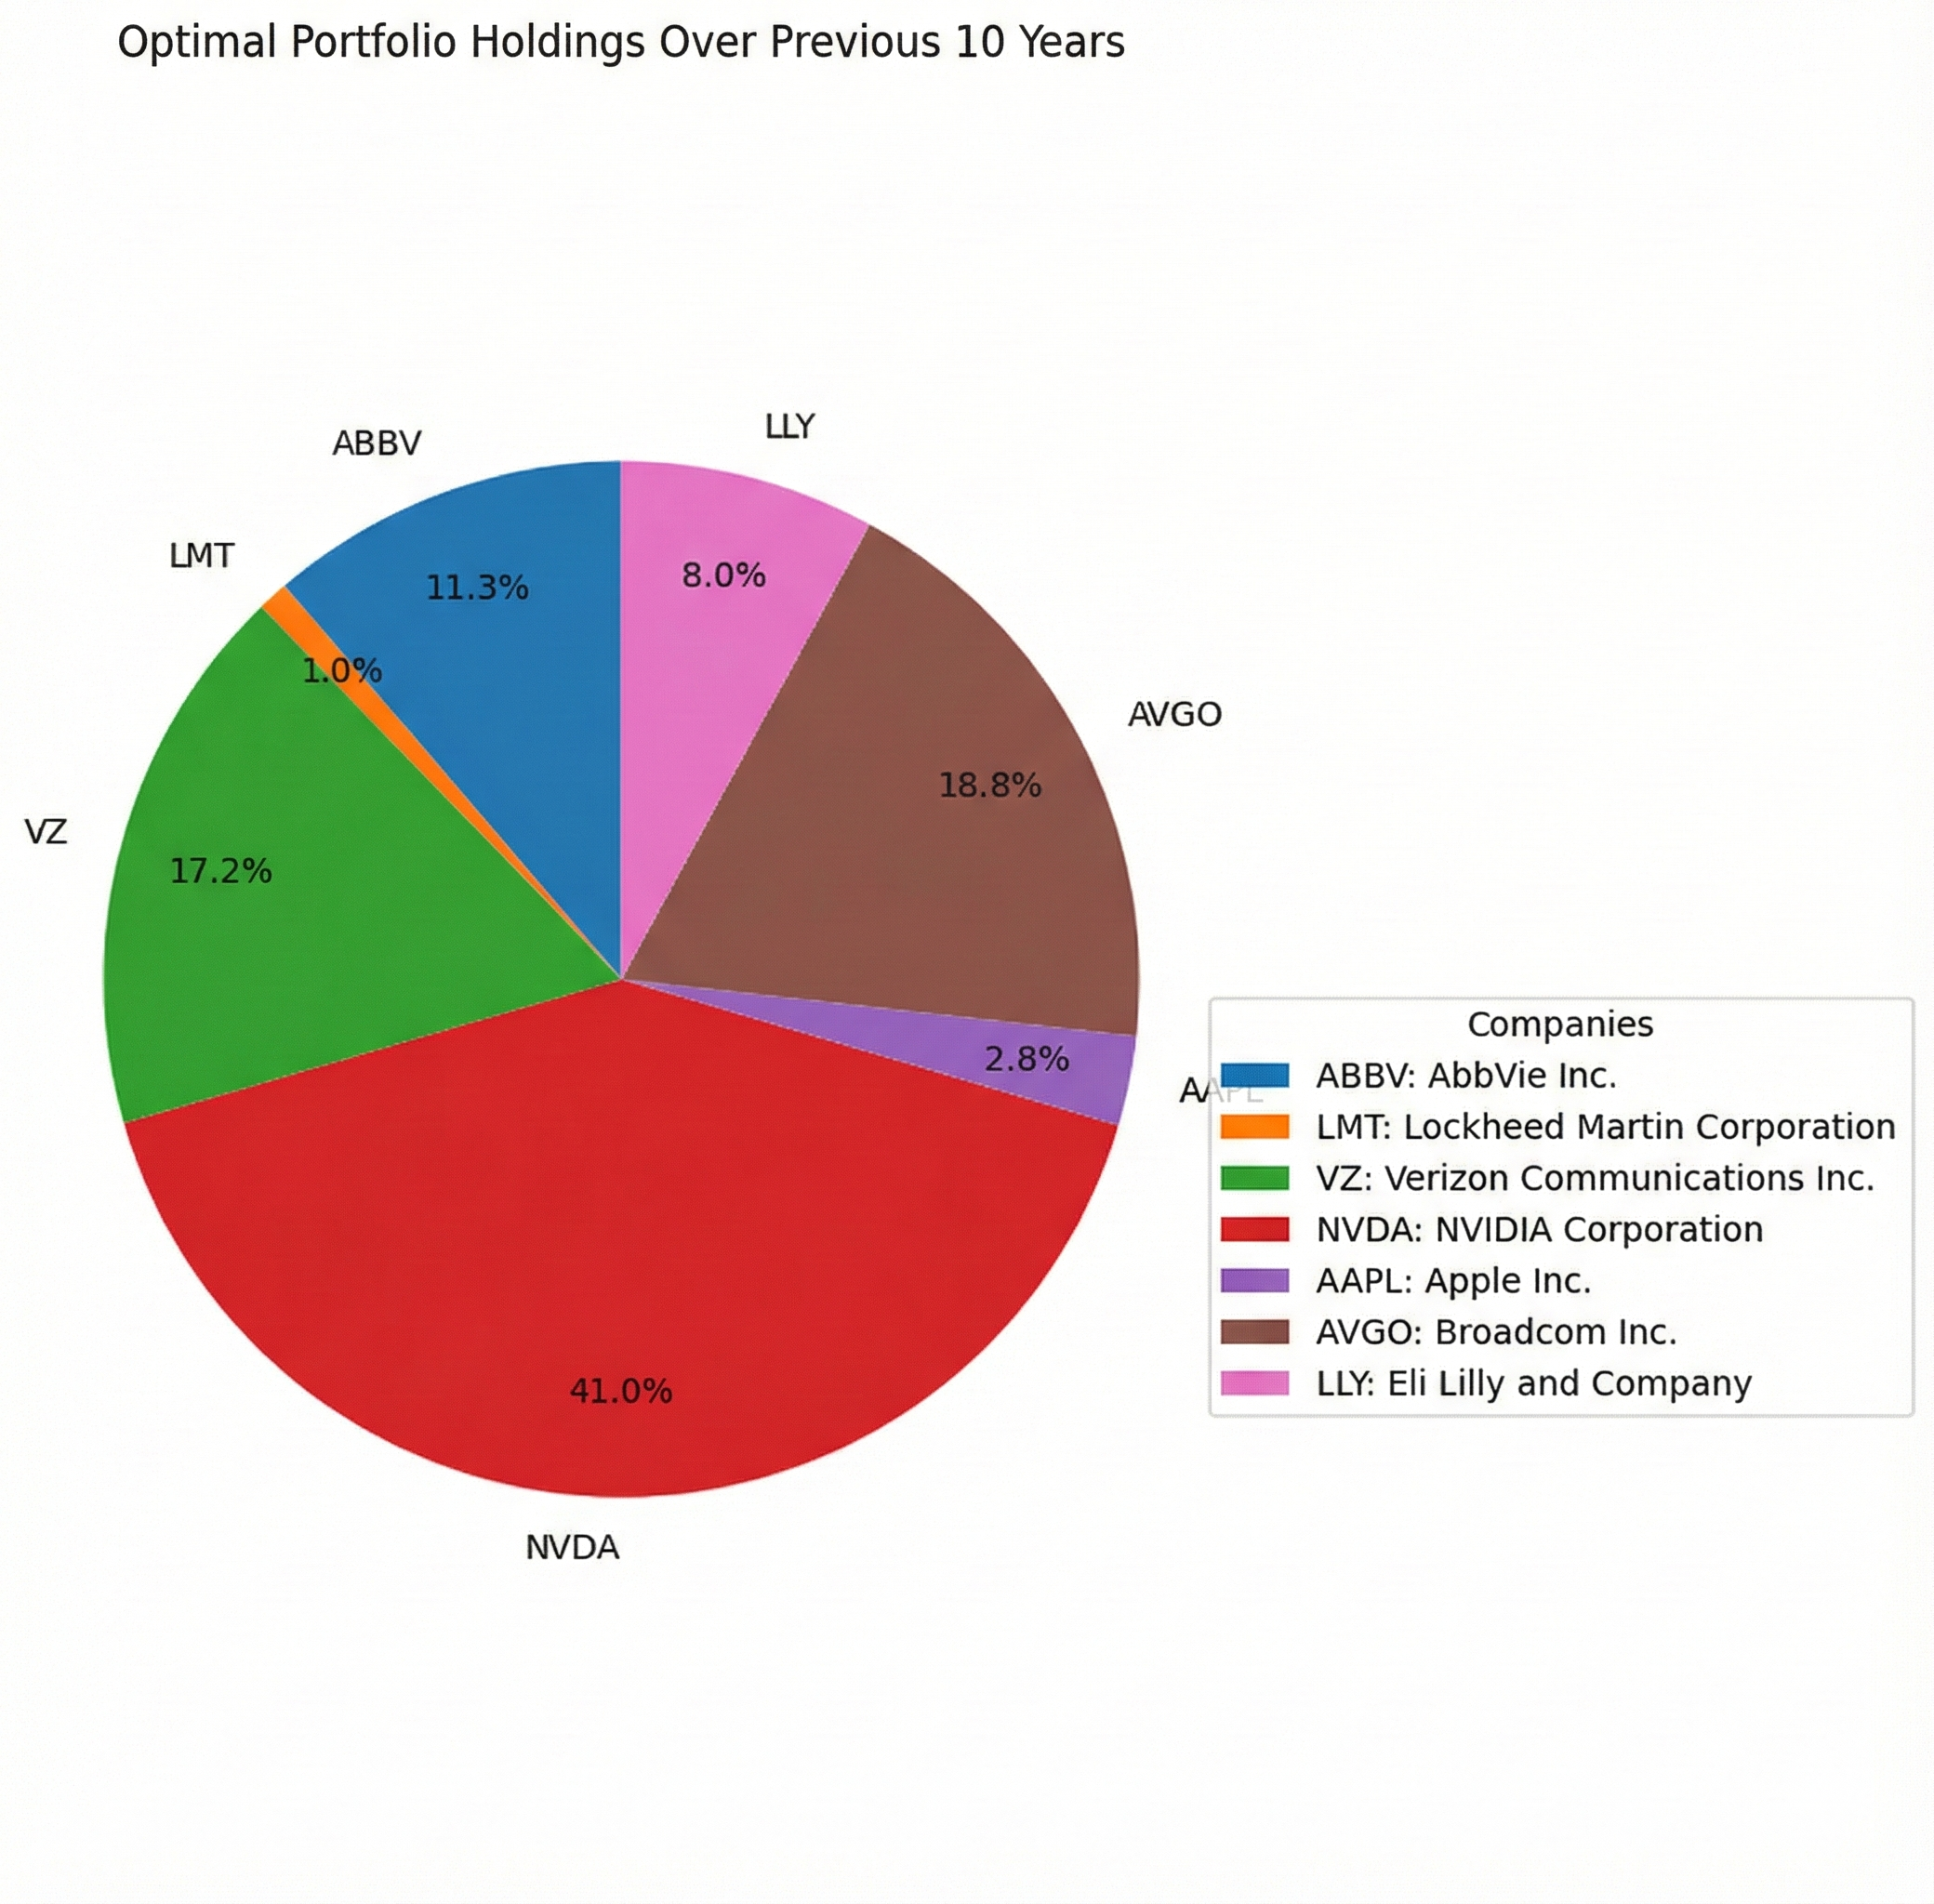
Takeaway:
Even when you let the optimizer choose from a wider stock menu, it still tends to produce a portfolio that echoes the ETF conclusion:
A growth engine + a dividend stabilizer is a strong design pattern.
Limitations (a.k.a. why I’m not starting a hedge fund tomorrow)
A few important caveats:
-
Optimizing on the past is overfitting.
Historical “optimal” allocations can be overly tuned to the exact period studied. -
Regimes dominate results.
Short windows can accidentally become “a tech boom study” or “a recovery study.” -
Companies change category.
Growth companies mature; dividend payers innovate; labels are not permanent truths. -
Sharpe ratio has blind spots.
It treats volatility symmetrically (up and down moves both count as “risk”) and assumes returns behave more nicely than they often do. -
Taxes and frictions are real.
Collecting dividends also means additional taxes in taxable accounts; rebalancing and trading introduce costs.
So no: this doesn’t “prove” dividends will outperform.
But it does strongly suggest:
Dividends aren’t irrelevant. They’re structural support for your portfolio.
Practical advice (the only part not pretending to be a research paper)
Remember, I am by no means Warren Buffet or a financial advisor. However, if you forced me to turn this study into a rule-of-thumb:
- A roughly 50/50 growth/dividend split is a surprisingly robust starting point.
- Tilt more growth when:
- you have high risk tolerance,
- you’re early in accumulation,
- you can emotionally survive drawdowns without panic-selling.
- Tilt more dividends when:
- you value stability and reinvestment compounding,
- you want income (or psychological comfort),
- you just want a portfolio you can ignore without developing a twitch.
The point isn’t to pick a team.
The point is to build a portfolio you can hold through multiple market moods.
Dividends are not dead money.
They’re the ballast that keeps your ship upright—especially when the market remembers gravity exists.